Visual Literacy Program
Established a global learning program and community of practice for Accenture Advanced Analytics.
- Client
- Accenture
- Year
- 2013-2015
- Role
- Program Lead & Curriculum Designer
- Timeline
- multi-phase: course development, launch, global travel, sustained community
By combining structured online learning with in-person connection and community engagement, we built a sustainable ecosystem where advanced-analytics teams could develop visual-literacy skills and apply them to real business outcomes.
Why this mattered
Three interconnected challenges made this program critical:
- Accenture needed to upskill a global analytics team as the market rapidly evolved. New visualization tools were becoming essential to competitive advantage, but knowledge was scattered and informal.
- Teams were geographically distributed across many time zones. Reaching professionals in India, Greece, Spain, and the Philippines required a blended approach combining self-paced learning with high-touch in-person engagement.
- New employees needed onboarding while existing staff sustained momentum. Making the program required learning for new Advanced Analytics hires ensured knowledge-building at scale, while ongoing community engagement kept experienced teams advancing.
Approach
1. I translated business needs into a learning vision
I worked closely with leadership to understand business objectives and market pressures. Rather than a generic training program, the real need was organizational capability in visual communication and data storytelling, not just tool training. I researched data-viz thought leadership, design principles, and state-of-the-art techniques to inform the vision.
Leadership alignment around the program was critical as a strategic capability builder, not just training. A credible vision grounded in industry best practices resonated with advanced-analytics professionals, positioning the training as required learning enabled rapid adoption.
2. I built a multi-format curriculum to reach distributed teams
A single format couldn't serve a global workforce, so I built an integrated program with four complementary components.
- Online courses for foundational knowledge: three self-paced courses on visualization principles, tool fundamentals, and story-telling content.
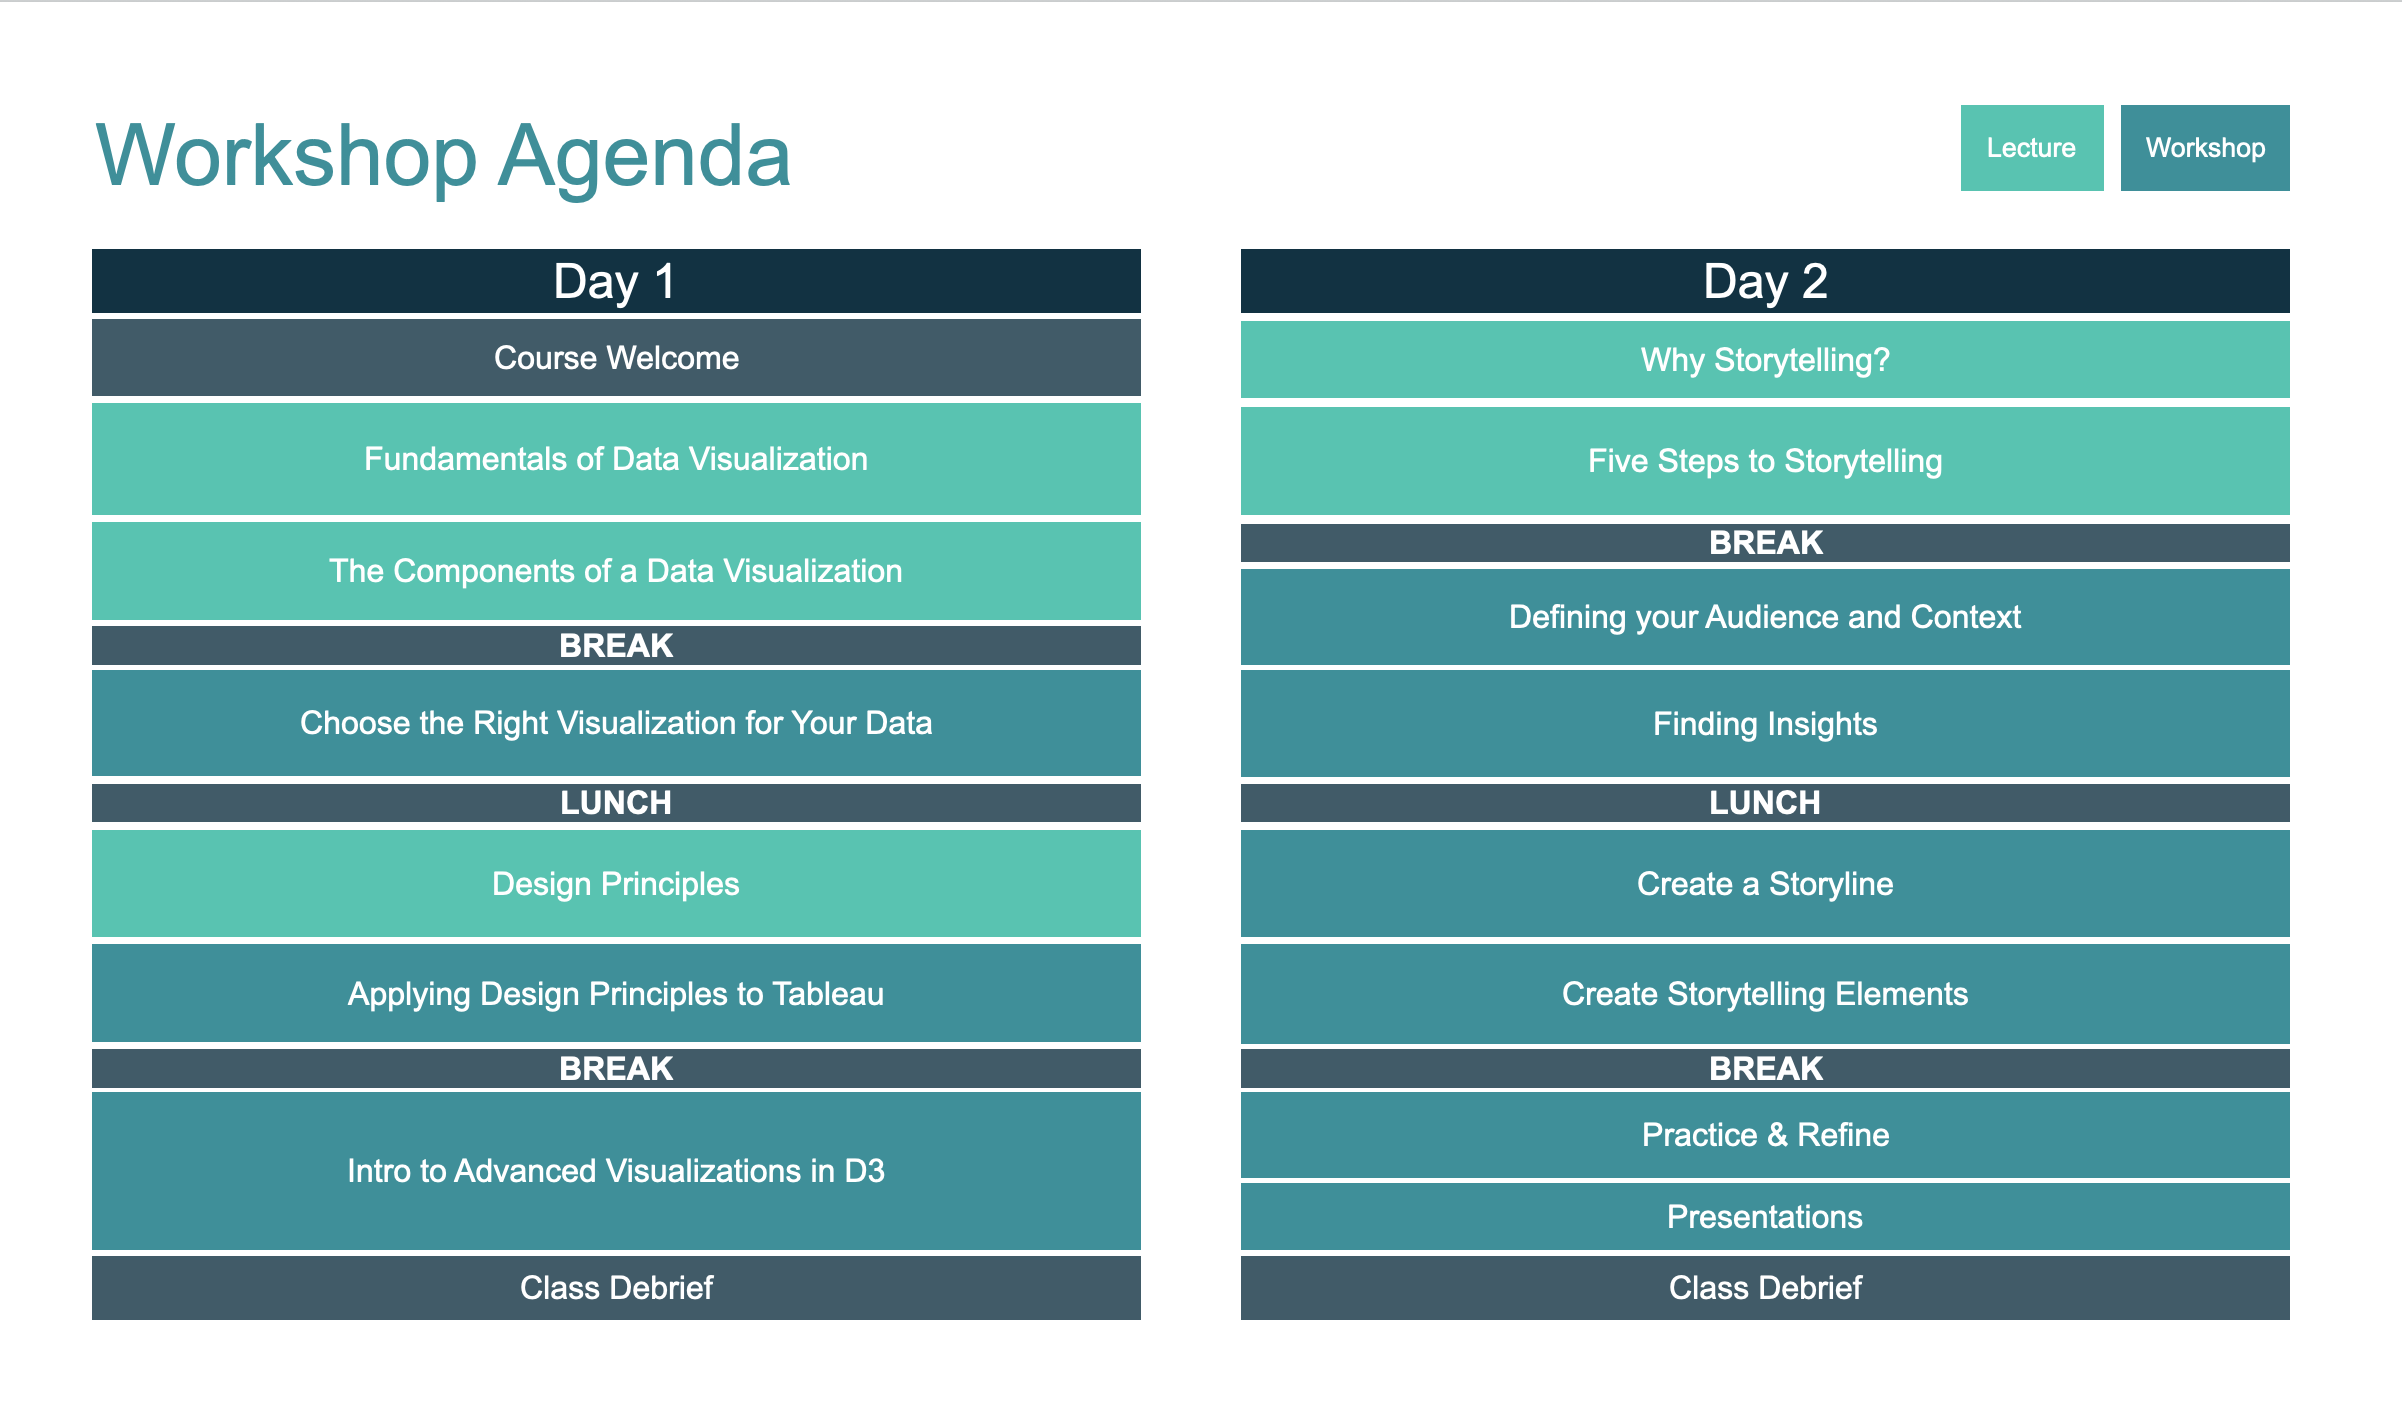
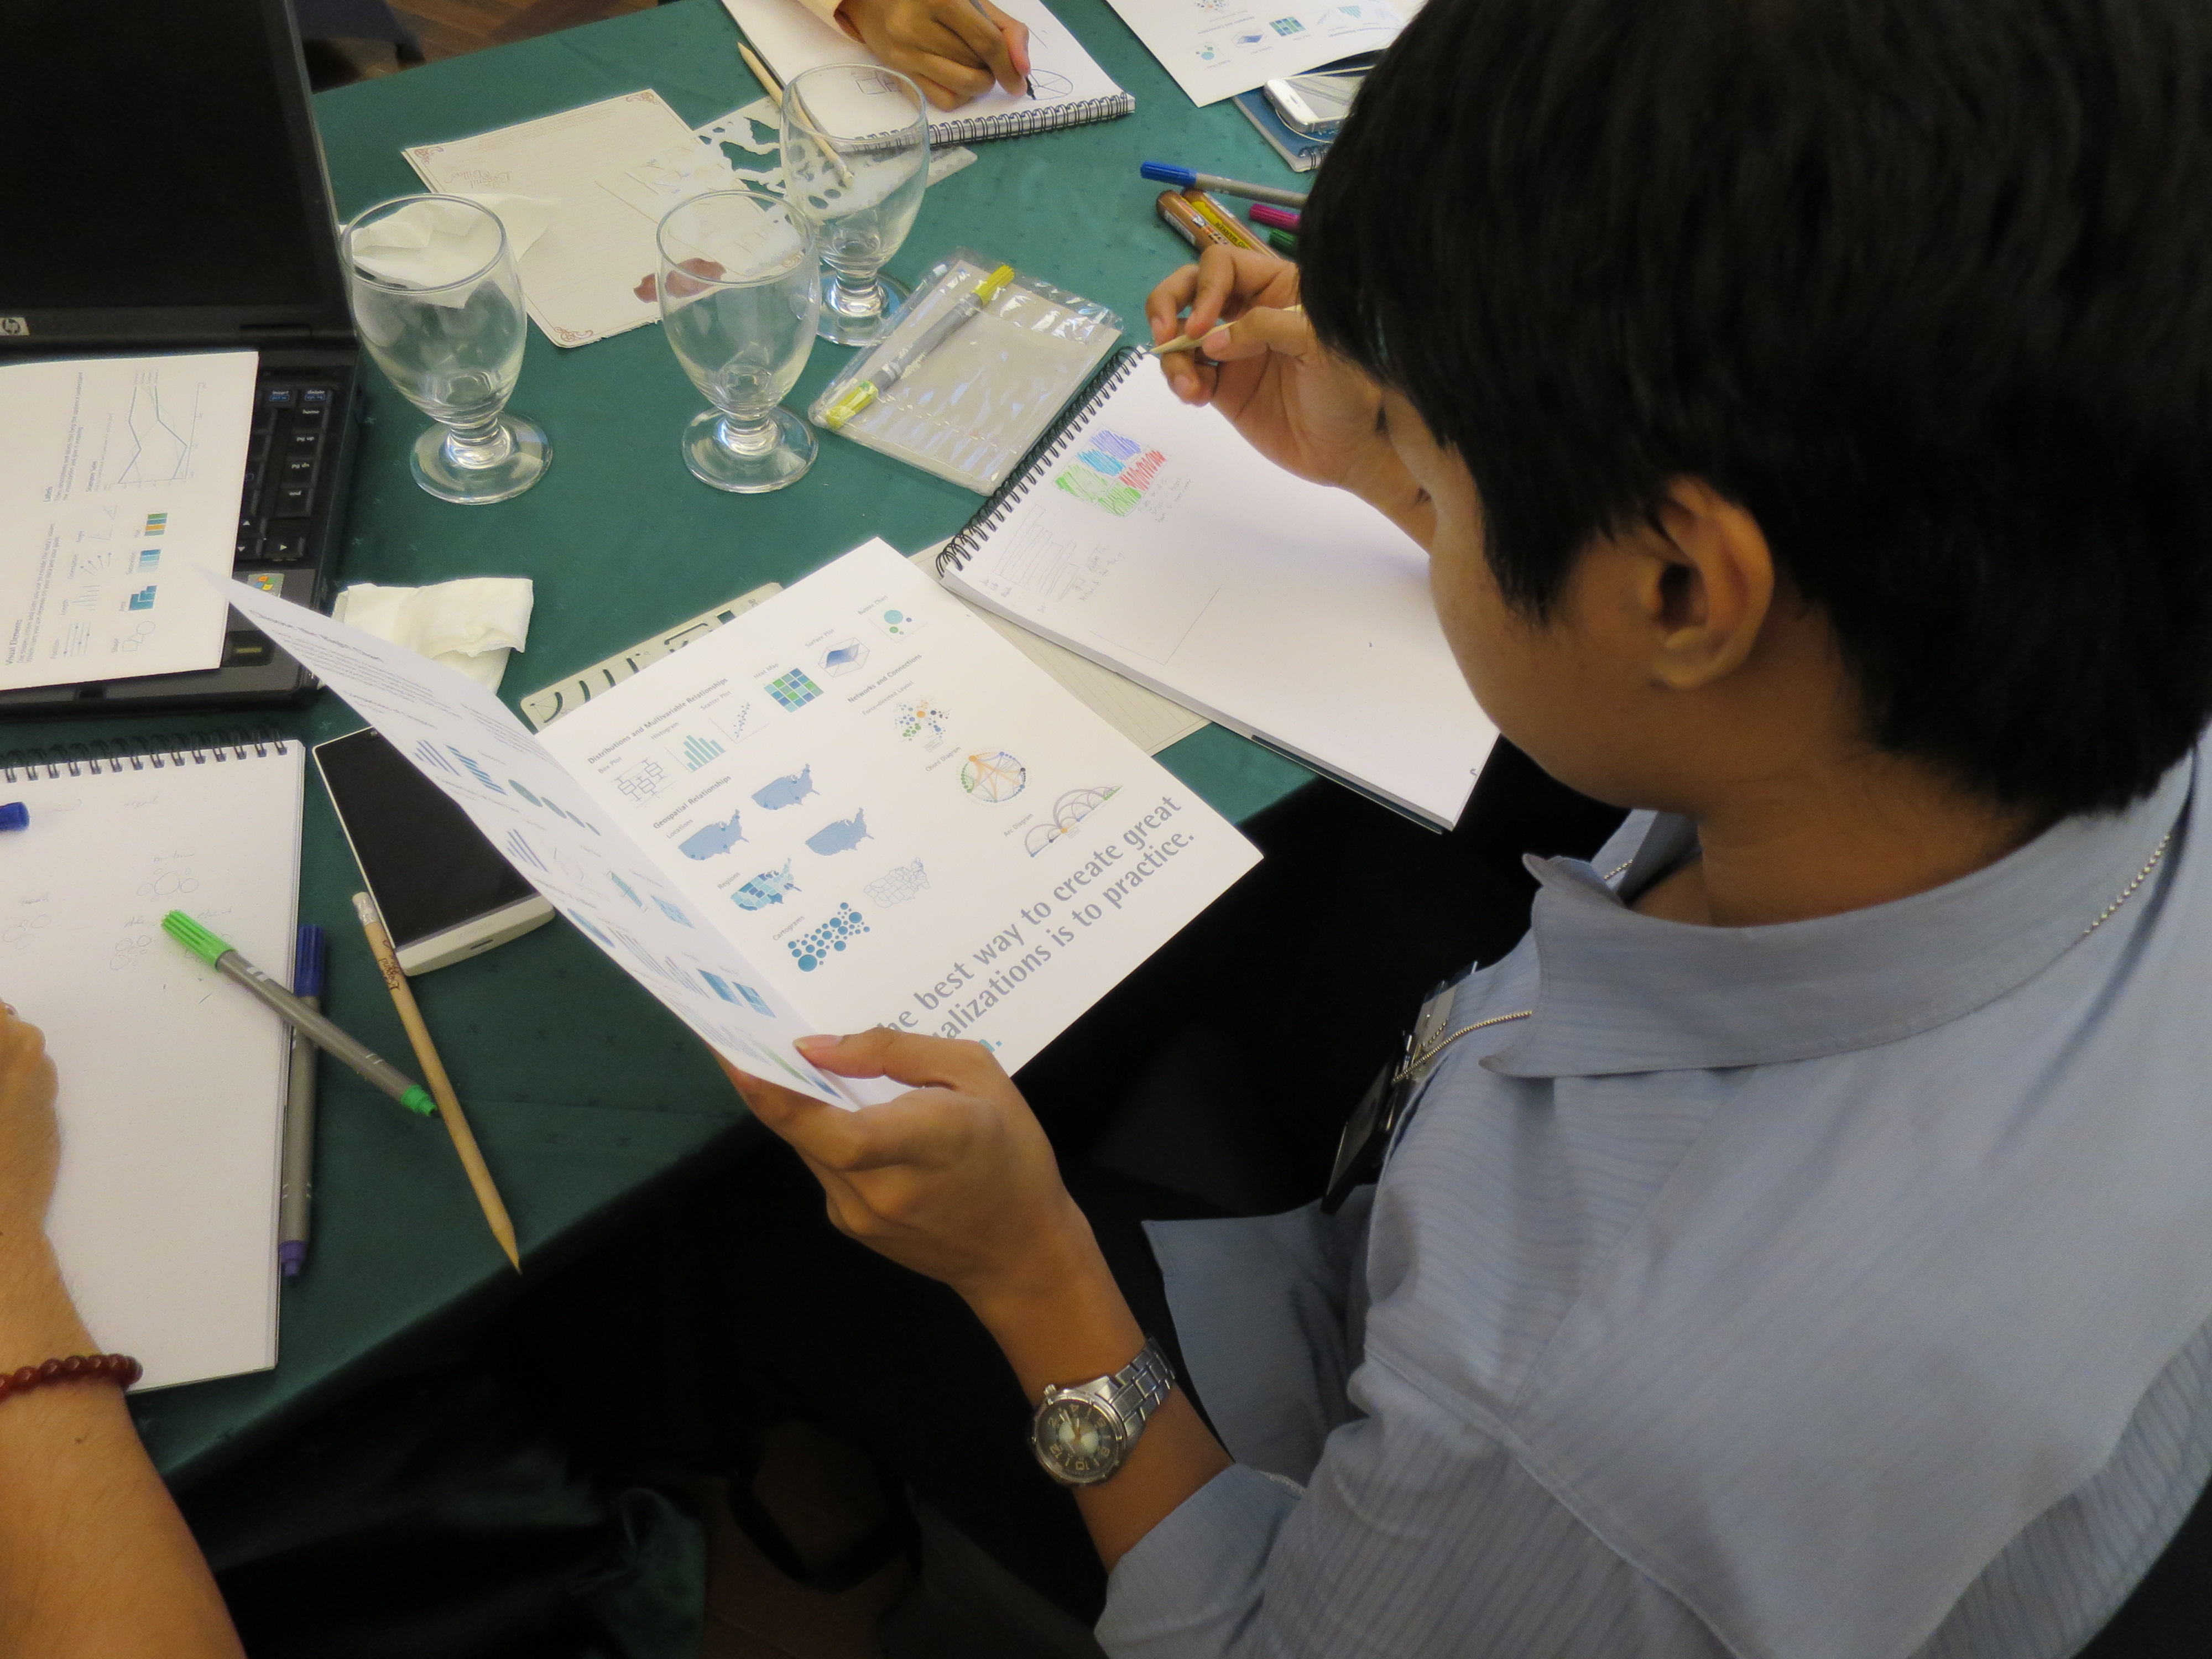
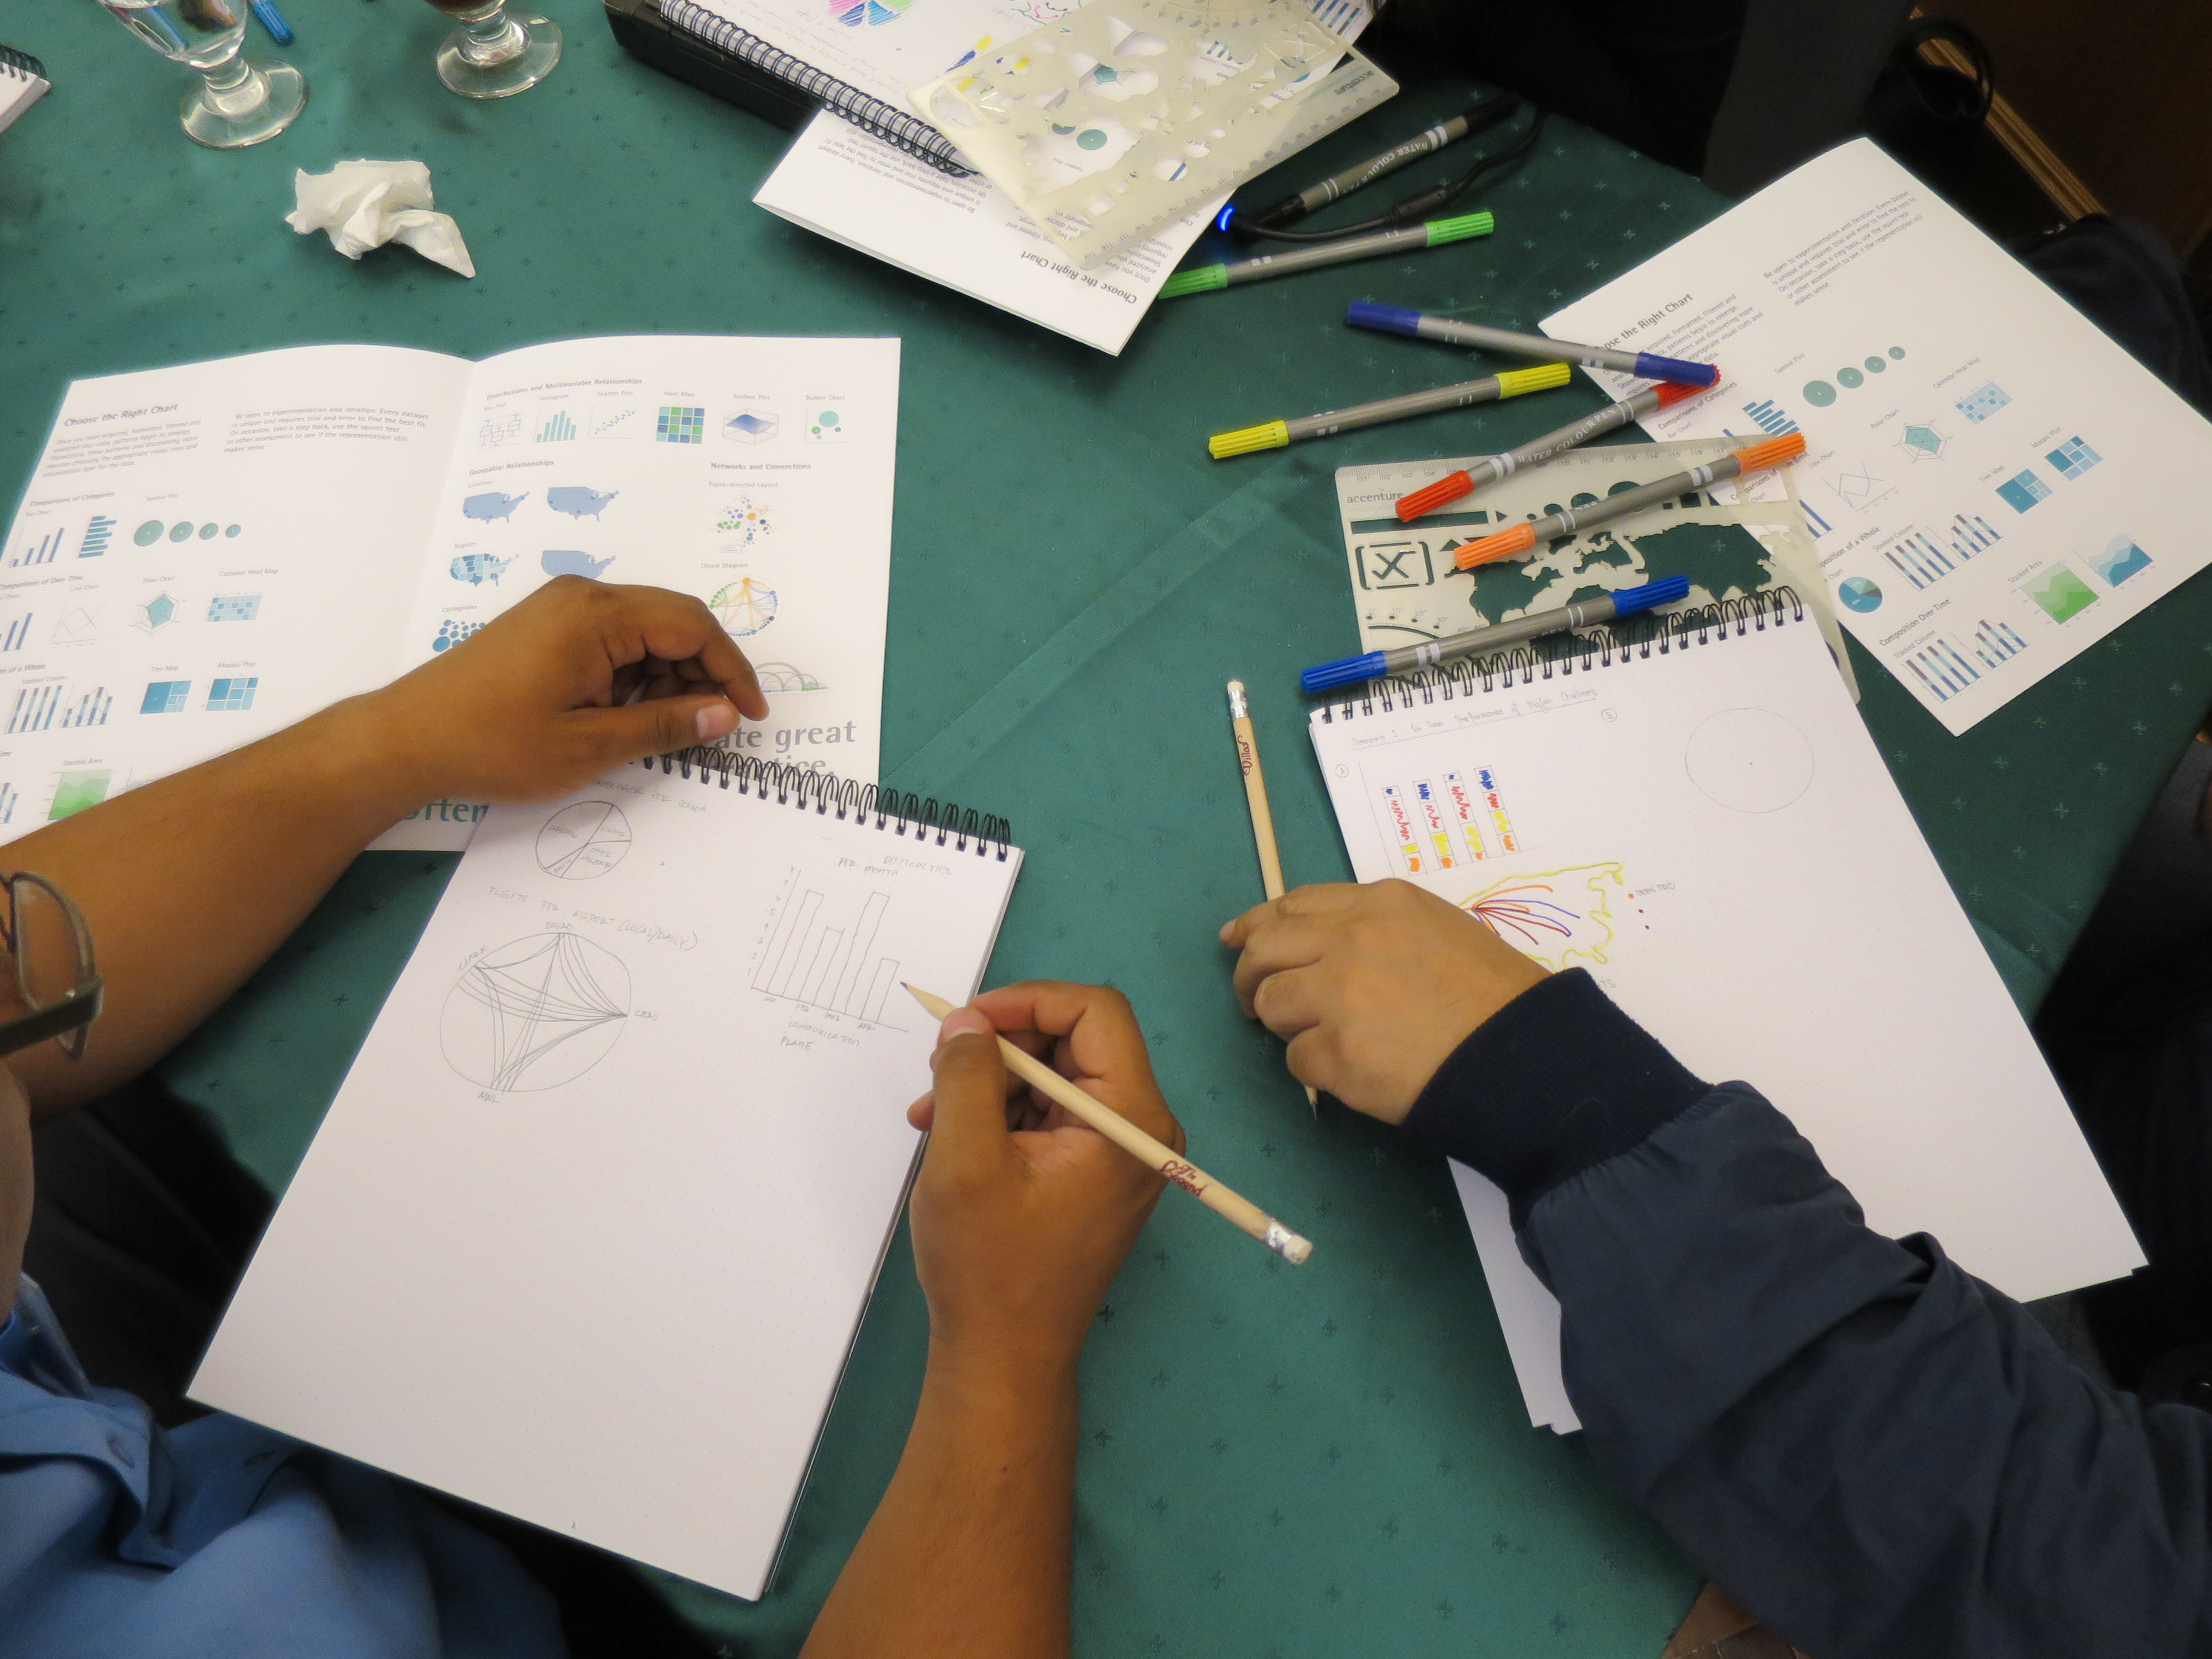
- Hands-on workshops for applied learning: in-person and virtual workshops for deeper skill, confidence, mentorship, and relationship building.
- Community of practice for sustained engagement: a shared platform to ask questions, share work, collaborate, and build peer networks, the engine for ongoing knowledge sharing.
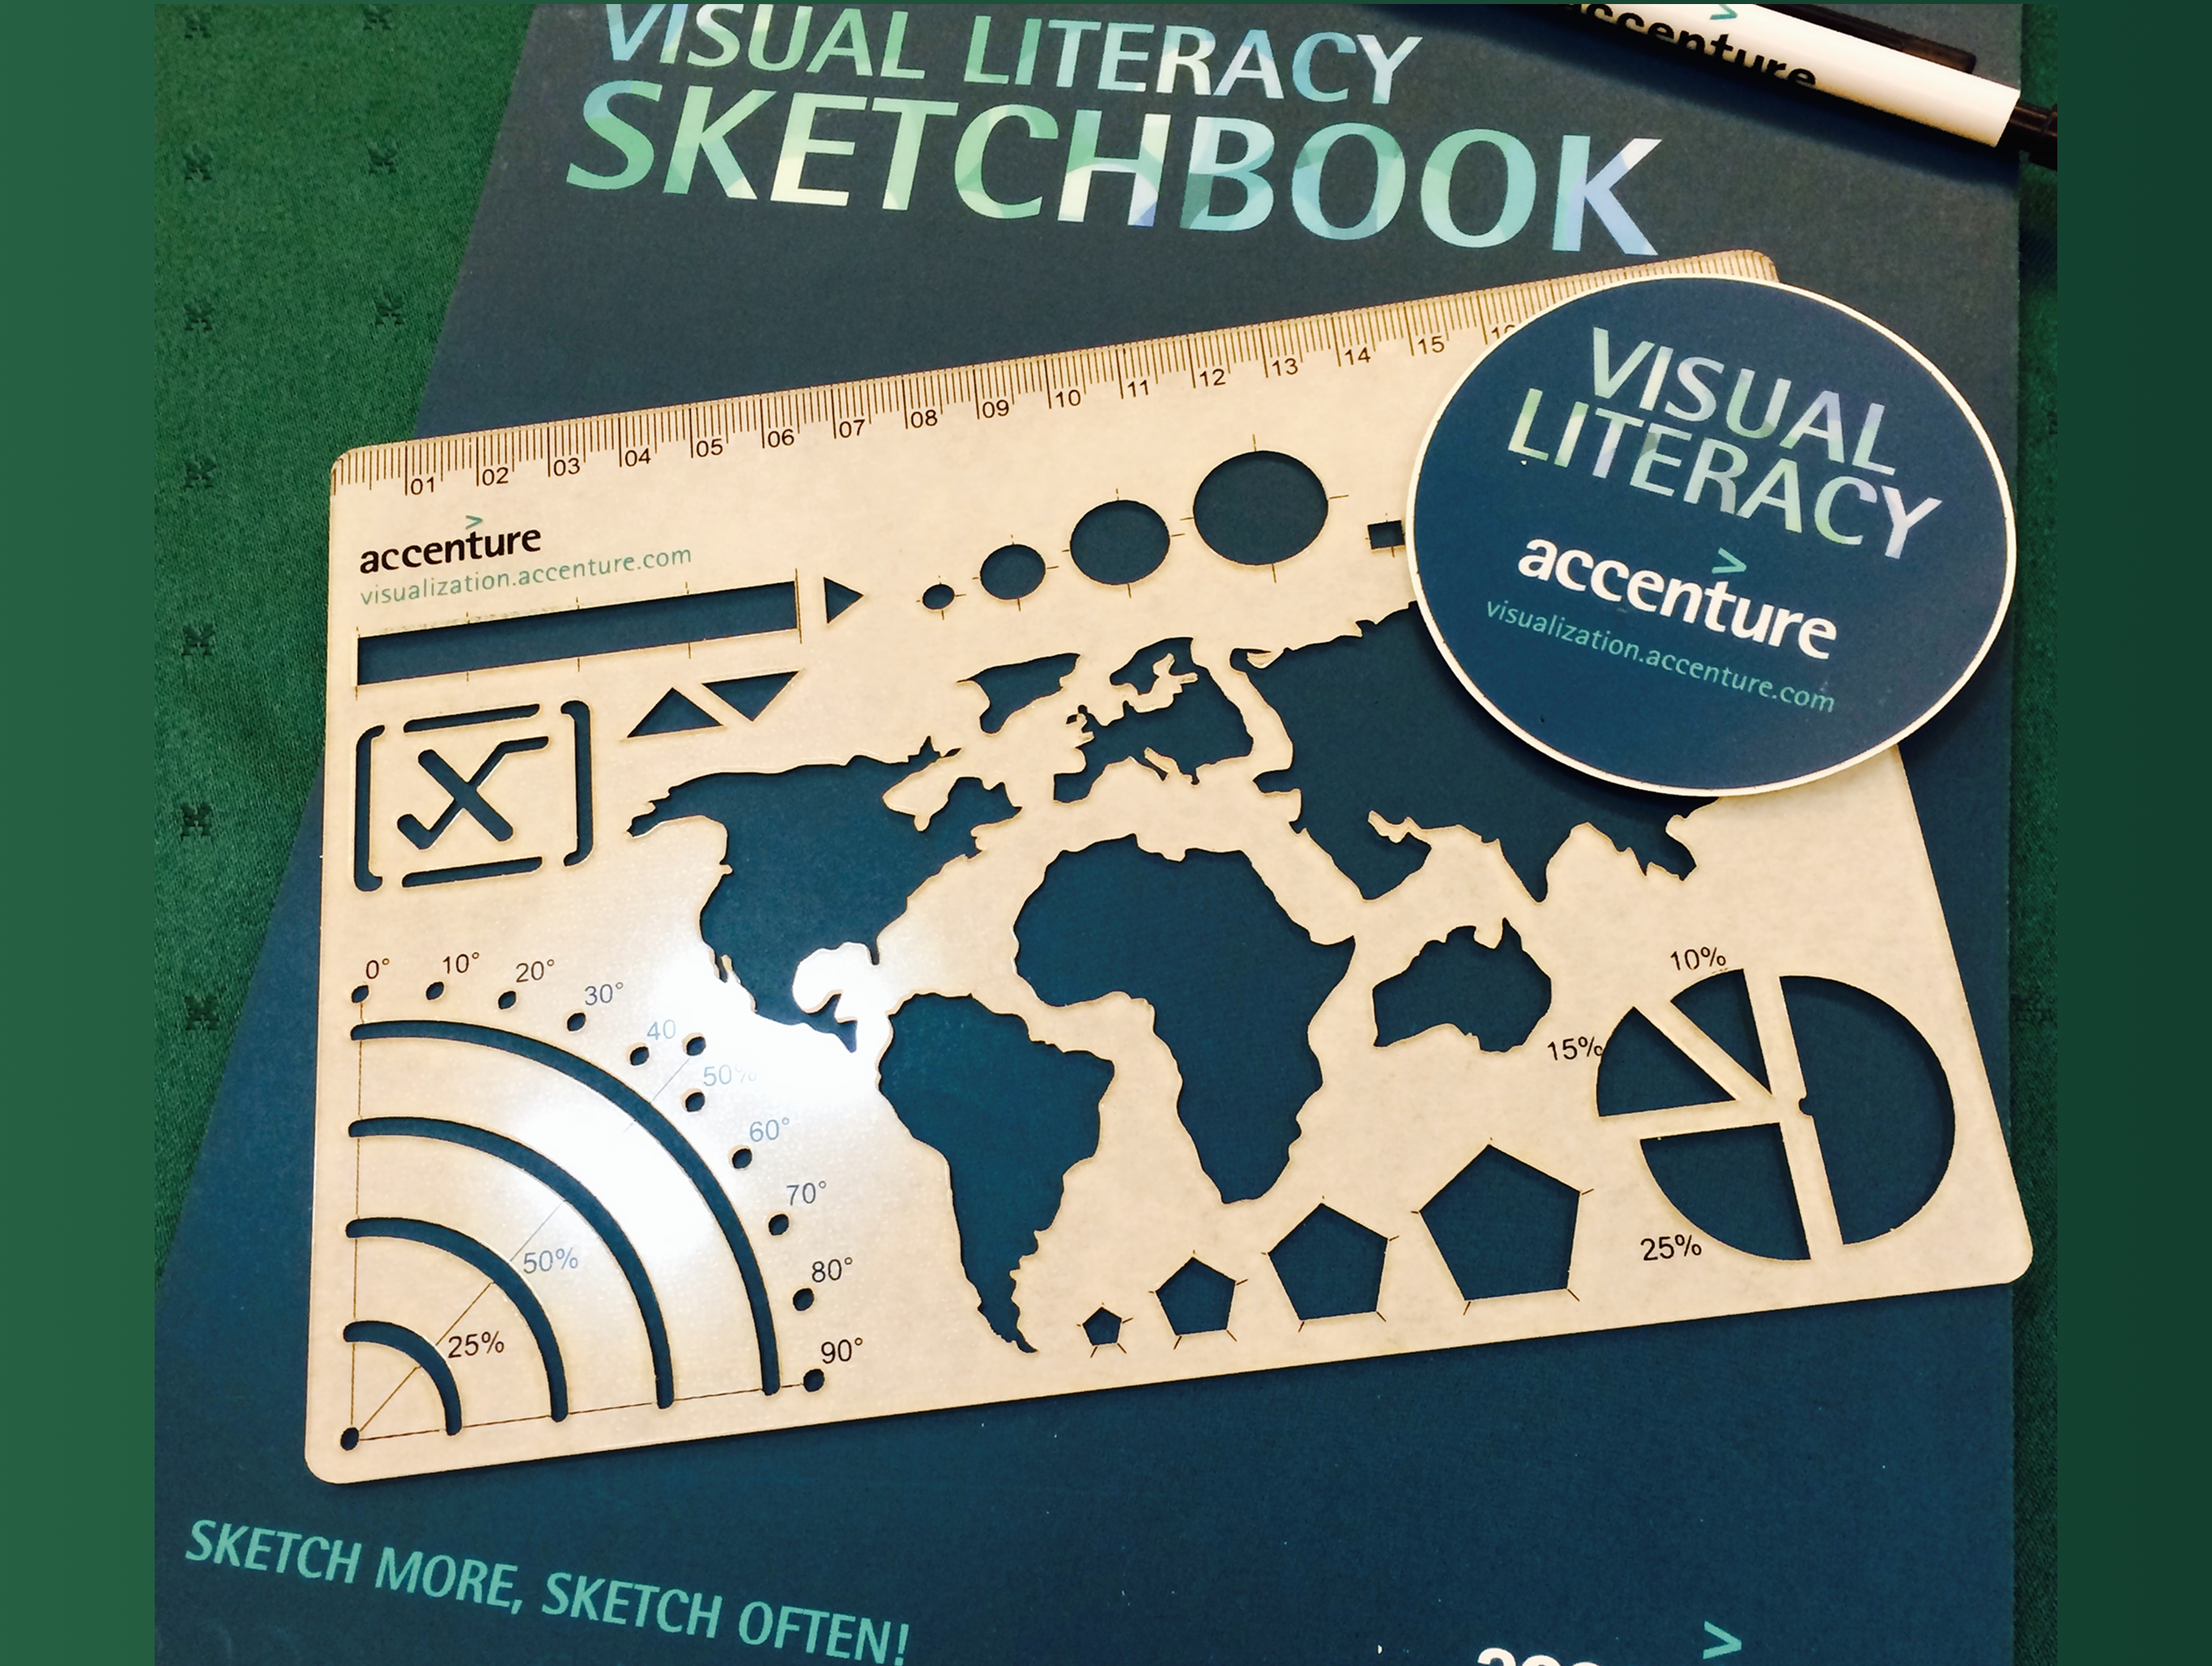
- Internal marketing communications: communication materials such as an intranet site, email campaigns, and promotional videos shared key course information, signaled management support, and created excitement.
3. I sustained engagement through in-person connection and community care
Online learning alone couldn't drive adoption, so I paired global travel with continuous community support.
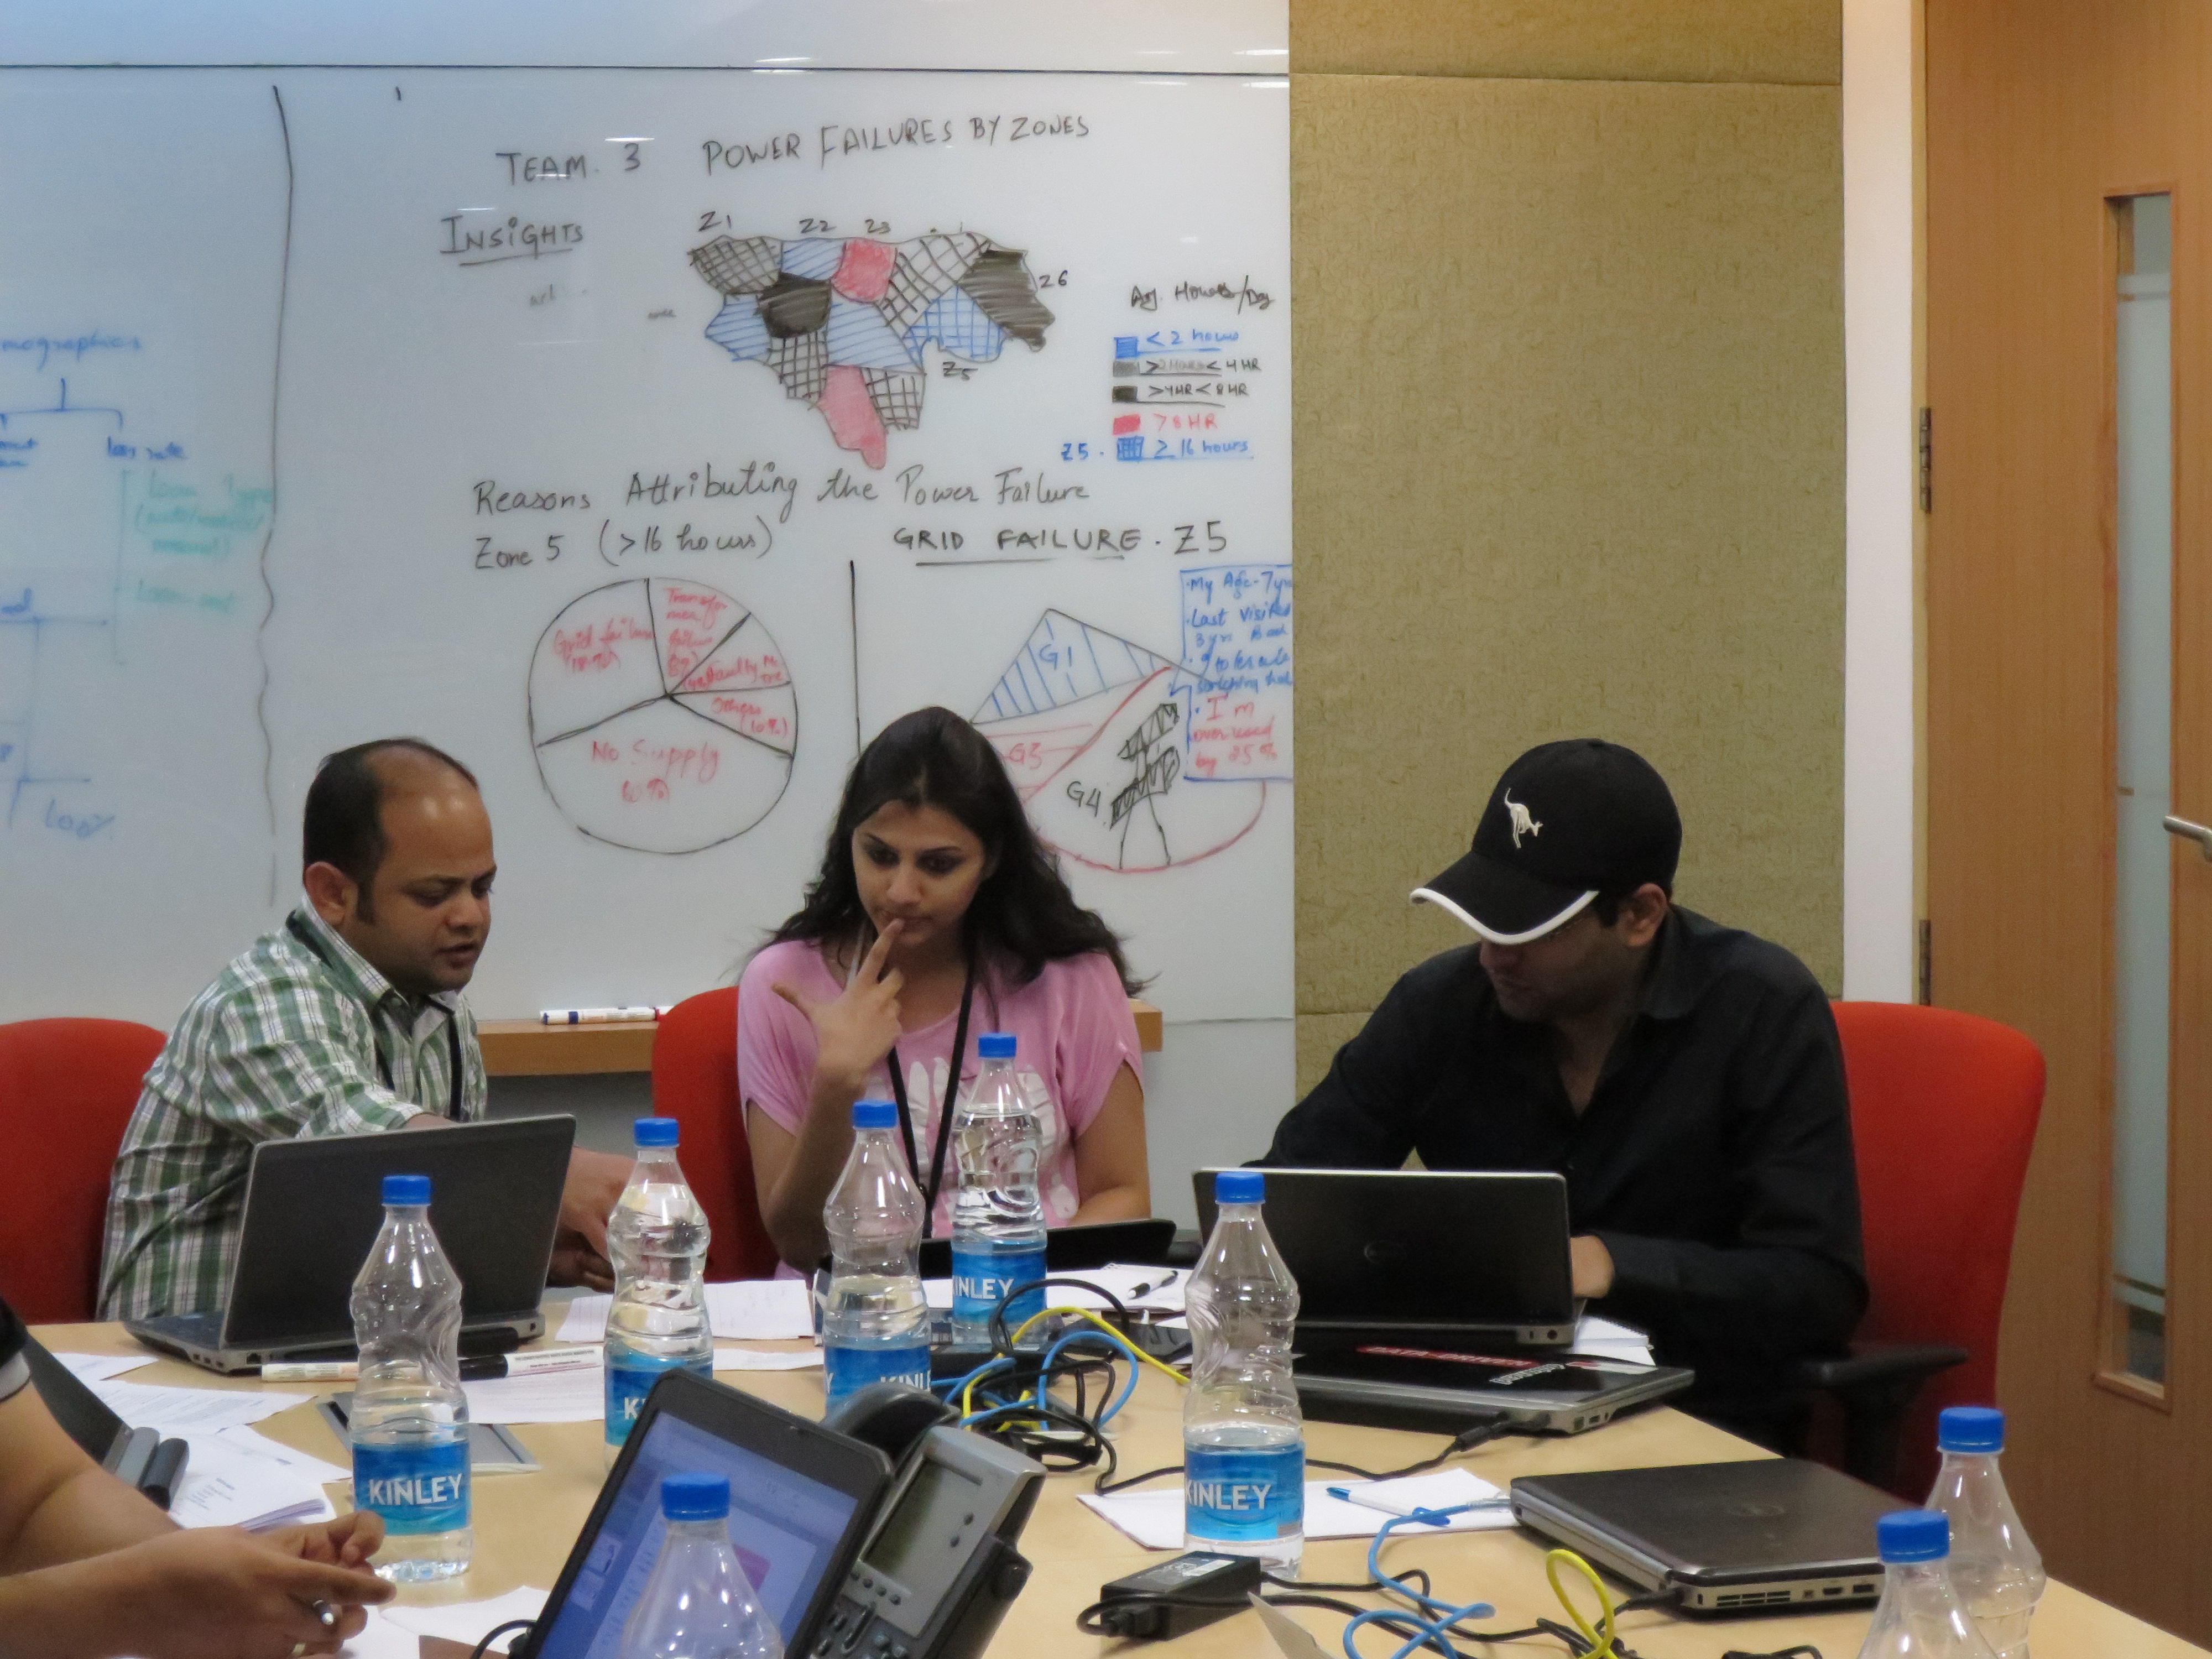
- Global travel & 'Train the Trainer' workshops: traveled to India, Greece, Spain, and the Philippines, equipping local leaders to champion the program and embed visual literacy into team cultures.
- Post-trip community care & outreach: brown-bag lunches, office hours, and creative challenges that kept the community engaged, answered emerging questions, and celebrated early wins.
Results
- The Data Visualization Community of Practice grew to ~30K members and continues to expand.
- The program became required learning for all new Advanced Analytics employees, embedding visual literacy into onboarding.
- Teams in Manila and India transitioned from PPT-based reporting to Tableau-generated dashboards.
- The program was white-listed and customized for Accenture clients, extending impact with key partners.
My role
Program Lead & Curriculum Designer
- Translated leadership's business objectives into a compelling, research-grounded vision.
- Researched visualization thought leadership, design principles, and techniques.
- Designed and developed the three-course curriculum and hands-on workshop content.
- Launched and scaled the Community of Practice to ~30K members.
- Executed the global travel program, leading 'Train the Trainer' workshops across four continents.
- Designed and ran post-trip outreach (brown bags, office hours, creative challenges).
- Partnered with leadership to position the program as required learning.